Visualizing Your Career Graph
Interact with your professional timeline, map skill connections, and export layout configurations.
Overview & Core Benefits
Visualizing your career graph is a strategic tool designed to help you analyze, optimize, and present your professional story. By transforming a static chronological list into an interactive network of skills, employers, and achievements, you can immediately identify critical linkages in your experience, identify gaps in your skill set, and prepare compelling narratives for interviewers.
Step-by-Step Walkthrough Guide
Follow these step-by-step instructions to master the Visualizing Your Career Graph workflow on the CareerCove platform.
Step 1: Initialize Your Interactive Career Mind Map
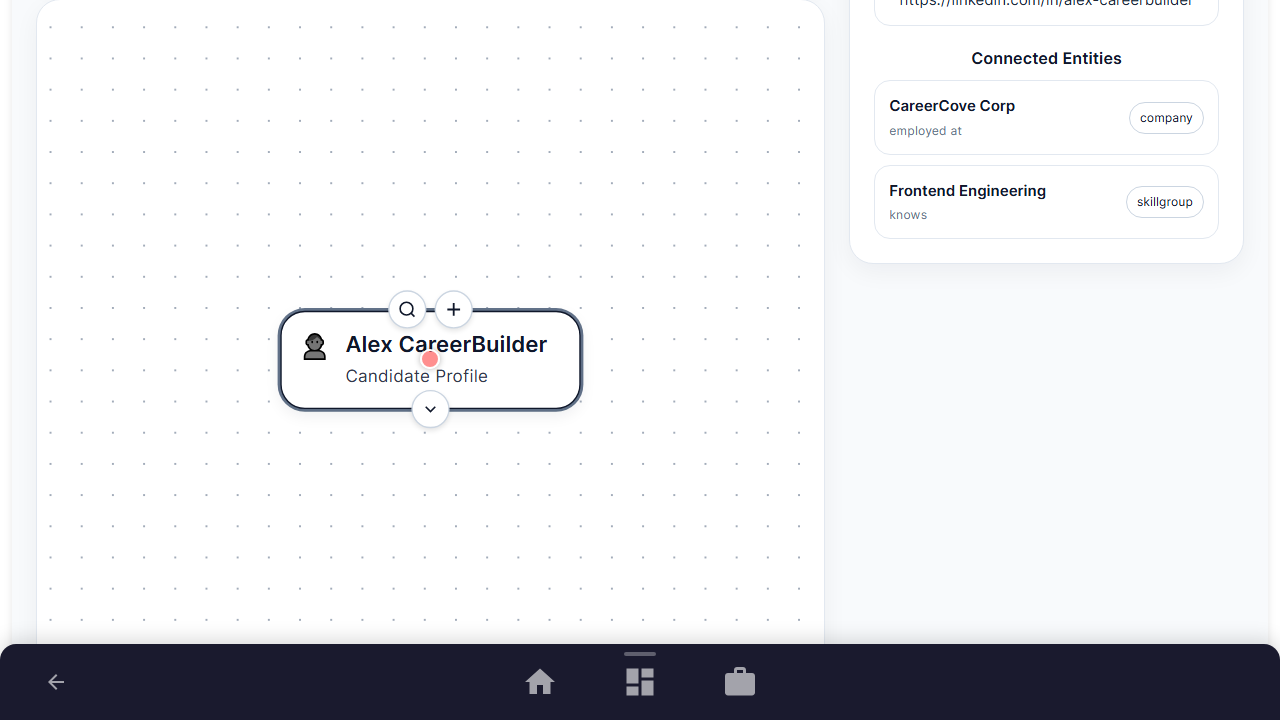
Navigate to the interactive Resume Graph section under your profile menu. Once loaded, the platform's layout engine automatically parses your career history, skills, and achievements, rendering them as a dynamic, interconnected mind map. The central anchor is your main profile node.
Purpose: Establishing a visual home base allows you to see the holistic connection between different phases of your career.
Benefit: Instead of scanning a flat, two-dimensional chronological list of jobs, you gain immediate, high-level clarity on how your experience is structured.
Outcome: You will see a centralized personal profile node (representing you) surrounded by primary branch nodes mapping out your key employers and technical capability clusters.
Step 2: Expand Experience Clusters to Drill Into Specific Roles
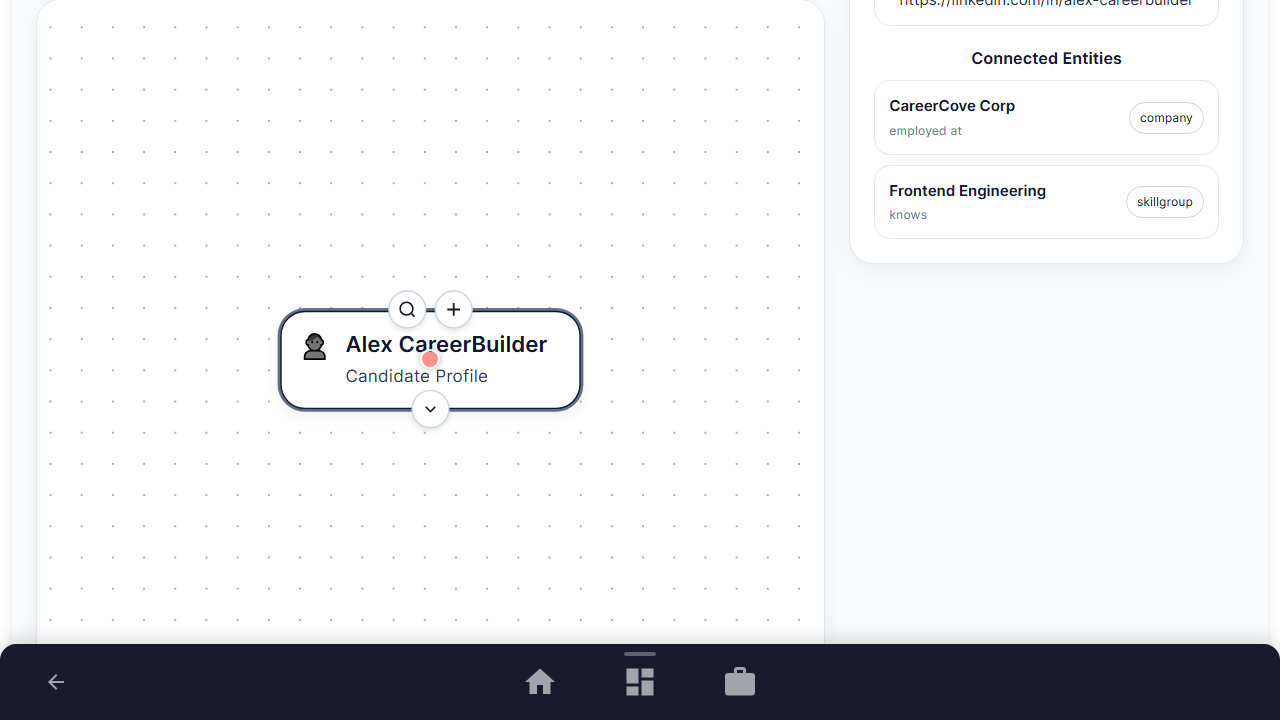
Hover over or click on any main employer/company node in the network graph. Clicking on an employer node triggers a smooth expansion animation, unfolding the child nodes that represent the specific job roles, projects, and achievements you compiled during your tenure at that company.
Purpose: To drill down into the granular details of a specific job segment without overwhelming the visual layout when viewing the entire resume.
Benefit: This allows recruiters or yourself to isolate individual chapters of your career, exploring projects, technologies used, and outcomes on a case-by-case basis.
Outcome: The company node expands outward to reveal sub-nodes detailing your role titles (e.g., Lead UI Developer), key accomplishments, and individual projects linked specifically to that tenure.
Step 3: Utilize Toolbar Controls and Focus Mode to Reduce Visual Noise
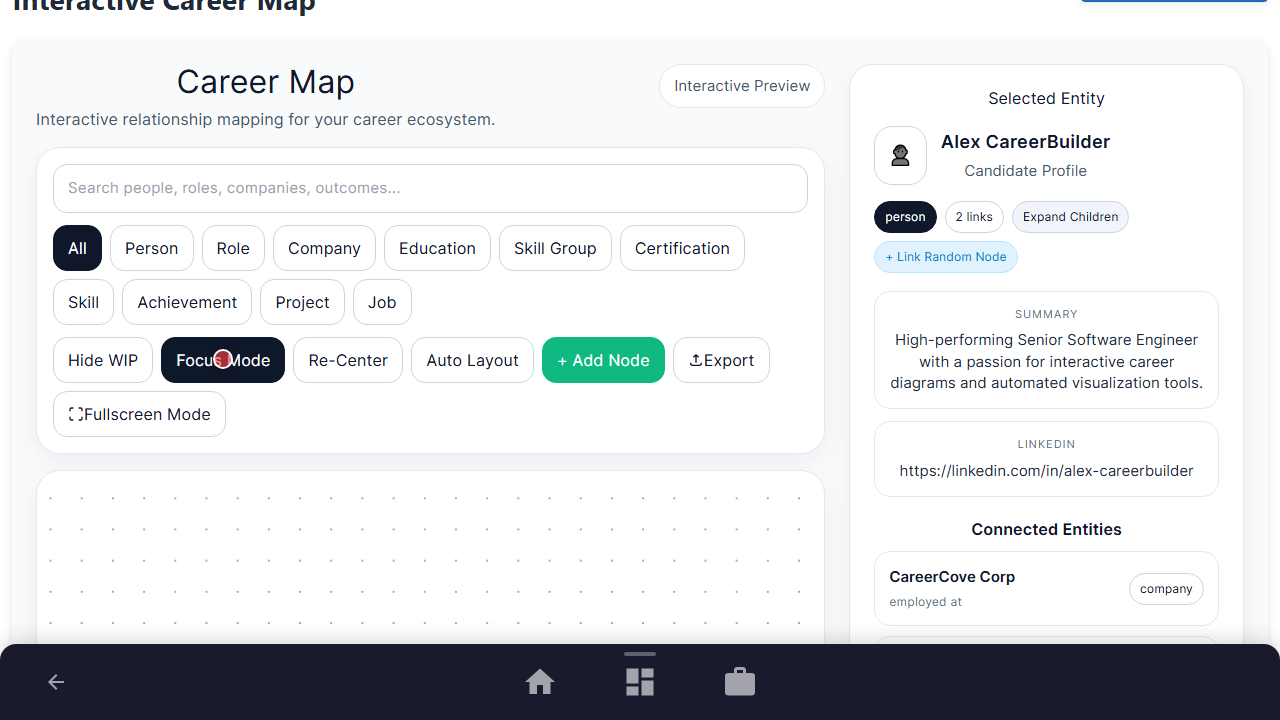
Locate the toolbar at the top of the canvas and click on the 'Focus Mode' button. When activated, Focus Mode dims out all unrelated nodes in the background and highlights only the node path you are currently hovering over or selecting.
Purpose: To isolate a specific career trajectory or skill progression path, removing visual distractions and helping you concentrate on one story at a time.
Benefit: Greatly enhances readability and presentation. When showing your portfolio to a hiring manager, it allows you to dynamically highlight a specific technology track (like frontend vs. backend) and all achievements associated with it.
Outcome: All nodes outside your selected career or capability pathway are dimmed into a subtle grey, while your active pathway remains fully lit and highlighted.
Step 4: Export Graph Data for Layout Backup and Offline Sharing
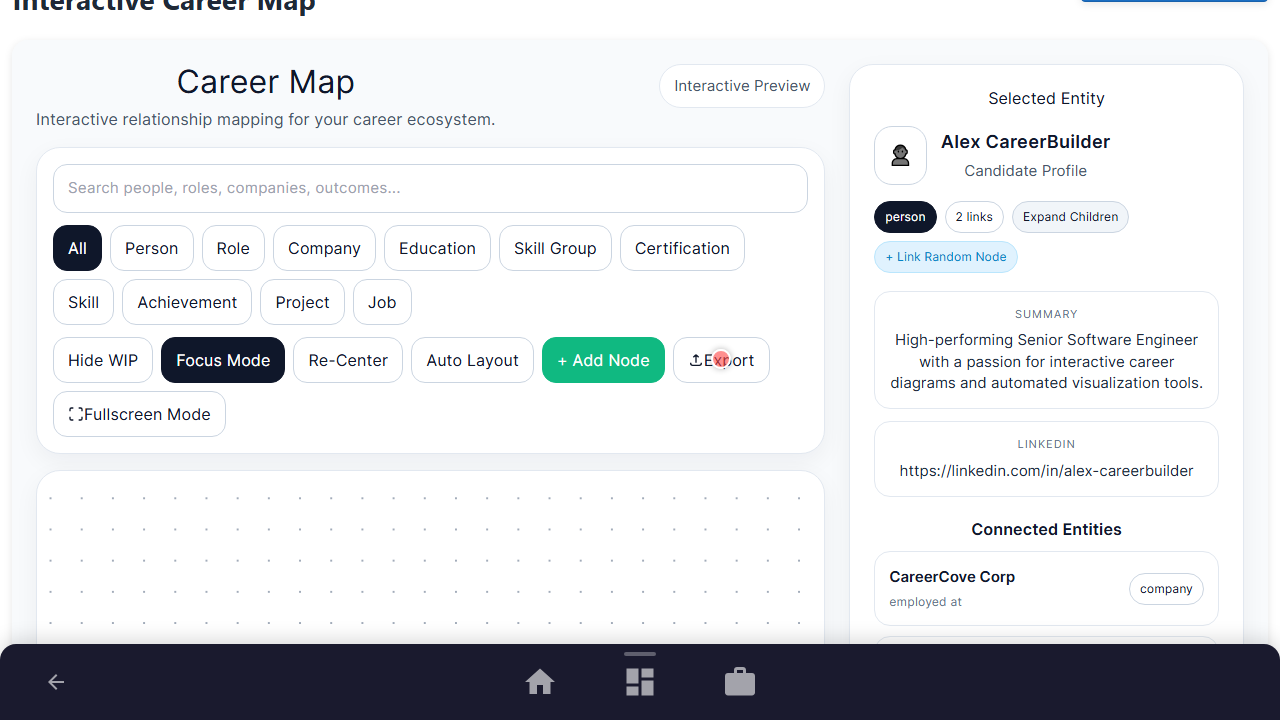
Click the 'Export' button located in the global graph toolbar. This action compiles your custom layout coordinates, node sizes, and visual relationships into a lightweight, portable JSON dataset, which is automatically saved to your local downloads folder.
Purpose: To back up your customized visual node layouts, ensuring that any manual adjustments or custom positioning you've done on the canvas are saved.
Benefit: Gives you full ownership of your data, allowing you to easily import the layout onto other profiles or share the structural career data with third-party visualization services.
Outcome: A JSON configuration file is downloaded to your machine, containing the raw coordinate and connection metadata of your personalized career graph.
See It In Action
Maximising Your Journey
Mapping your professional graph shows you a clear network representation of your credentials, helping you identify top skill clusters and highlight them in interviews.
Ready to apply this guide to your own career?
Register an account or sign in to save your progress, build and optimize your resume, and access advanced AI career tools.
Recommended Pathway Steps